Google Analytics for Web Designers & Developers
Hey all! Today, I want to introduce my good friend, Andy. Andy has been helping small businesses improve their online presence for over a decade. When I mentioned that we were considering a blog post about metrics and analytics, he jumped at the opportunity to help.
This post is a deep dive on Google Analytics and, despite spending a bunch of time in GA, I still learned a ton from it! We’d love to hear your thoughts and questions in the comments. Are you interested in contributing an article to the Beaver Builder blog? Shoot us a message!
We all know that Google Analytics is the go-to solution for monitoring website usage. But all too often we set it and forget it. We might look at traffic volumes and top-performing content, but we don’t dig deeper into the data.
As web designers and developers, Google Analytics can do so much more for us.
Google Analytics gathers a lot of data. By only glancing at a small part of it, we’re doing a disservice to ourselves, our clients, and their site’s visitors.
Heads up: I’m not going to dig into the technical details of becoming a Google Analytics power user here. There are already fantastic resources for that. Check out Annielytics, Occam’s Razor by Avinash Kaushik, and Google Analytics Academy for tutorials.
What I want to address in this post is the broader concept of what we can do with all that data.

What opportunities are we missing?
Let’s start with the big one: Data-driven insights to inform our recommendations.
Our clients look to us as their resident experts. And as we talk about what we should do next on a site, we should lean on existing data to drive our suggestions.
Google Analytics data can support our recommendations. After we make the changes, we can then point to the data as evidence that we made the right choice.
We can also curate the raw data in monthly reports to our clients.
Let’s say we have a client on a website maintenance plan. We should incorporate GA data, along with commentary. That way we’re doing more to prove our worthwhile providing value to our clients.
So that all sounds great, right? So how do we put that into action?
What are we looking for?
There are three major areas for us to look at for our clients’ websites. There’s overall site performance; individual page performance; and business impact.
Let’s dig into each one.
Overall Site Performance
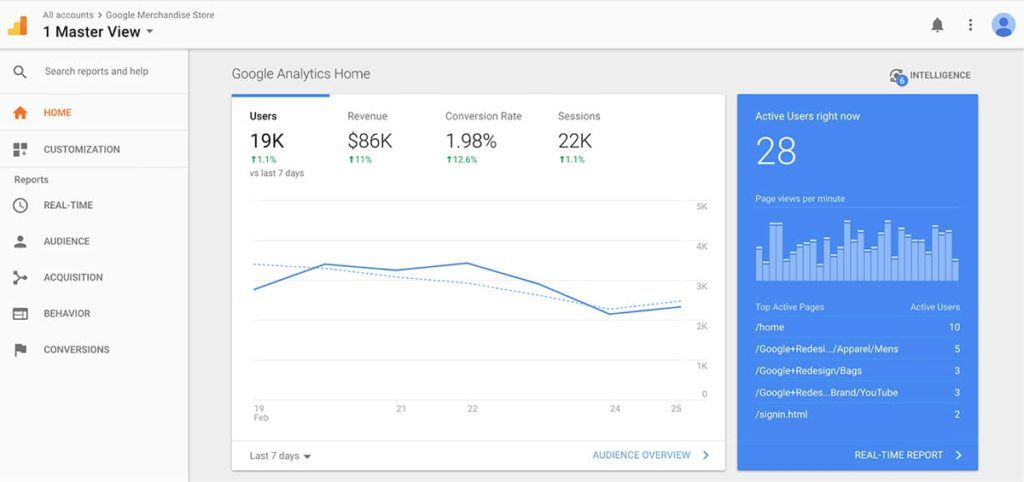
Overall site performance is what you’re (probably) looking at the most right now. It’s the first thing Google Analytics shows you. This is where we’re answering questions like: How much traffic is the site receiving? Where is the traffic coming from? What devices are being used? What’s the breakdown of new versus returning traffic?
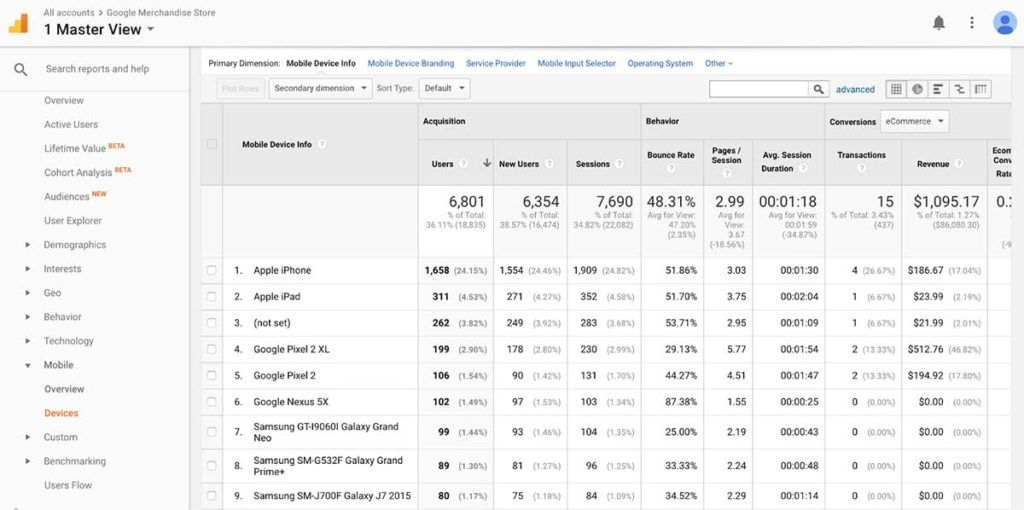
On the technology side, you can look to these stats for an idea of what to improve on the site. E.g. you might see a significant difference between desktop and mobile traffic behavior. This could be a symptom of a disparity in the user experience. Or it could be that the site is more often used in one context than another.
“Mobile Devices” report in Google Analytics. Source: Google Analytics demo account
Whatever the case, spotting possible issues via Google Analytics is a good first step. before investigating further via performance audits or usability testing.
Speaking of which – let’s talk about individual page performance.
Individual Page Performance
Some pages are more important than others, and we want to nail their performance. That includes user experience; optimization/page speed; and driving to conversions.
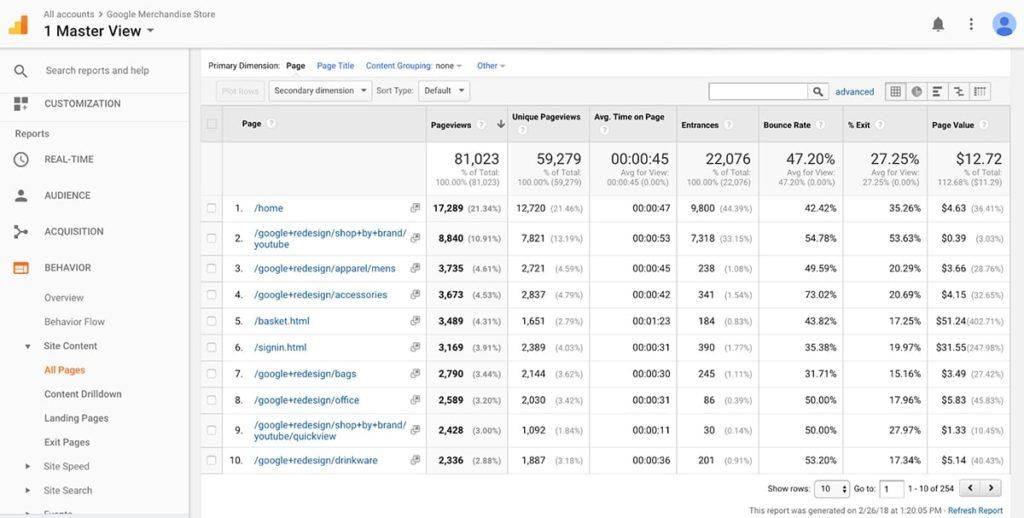
We’re looking to answer questions like: What pages are bringing in the most traffic? Where is that traffic coming from? How are those pages structured? What’s the technical performance like? What’s the page engagement like?
“All Pages” report in Google Analytics. Source: Google Analytics demo account
Let’s look at a few examples here:
First, let’s say you’re working with an eCommerce business. Certain pages will be more critical than others. The home page. Product categories. Individual products. Search results. The shopping cart. Checkout pages.
Related: The ultimate guide to improving eCommerce conversion rates (via ConversionXL)
You get the idea. Each type of page has a role to play, and small adjustments to those pages can make a big difference. You’re looking to optimize for product searches and conversions to purchases.
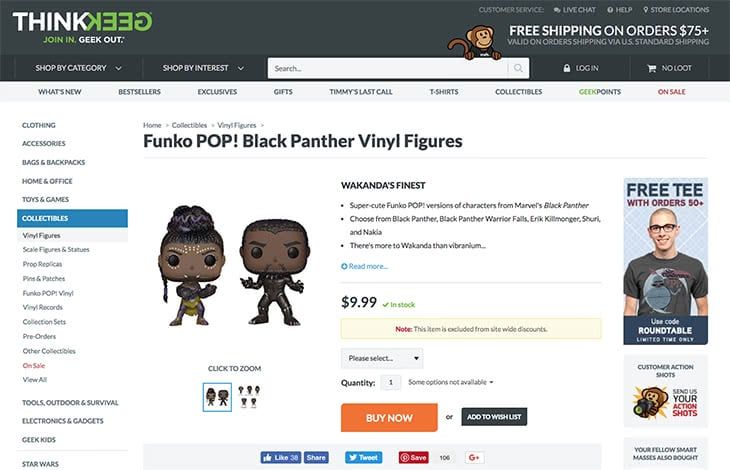
Example of a single eCommerce product page. Source: ThinkGeek
Now, what about a lead generation website for a real estate broker? They’re not selling products. They don’t have a shopping cart or checkout pages. But they’ll have property listings and informational pages. They’ll target geography, down to a neighborhood, and optimize for local search. And on these pages, you’re looking to optimize for qualified lead capture.
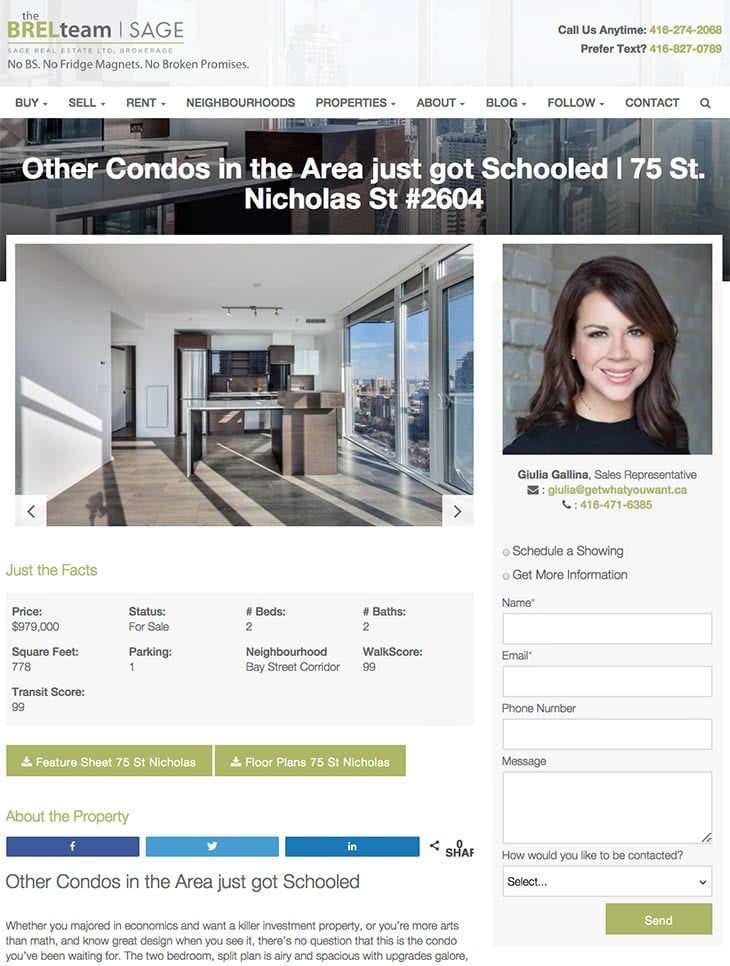
Example of a property listing page for a real estate broker. Note the prominent placement of the lead capture form. Source: The BREL team
And last but not least, what about restaurants, bars, cafes, diners, and the like? These establishments are all about the “what’s near me” search results. Their sites need to kill the local search optimization. They need to optimize for mobile. They need to be fast.
Related: Top tips for small businesses to dominate local SEO (via GoDaddy)
Think about their on-the-go customers. They’re looking for specific information: the menu; the location; hours; reservations. The homepage is going to be super important for a business like this, and a high bounce rate is normal. You might also optimize for conversions, like placing reservations or ordering delivery.

Toronto student hotspot Salad King prioritizes their menu and social media on a responsive, mobile-first website. Source: Salad King
So for each page (or type of page) on the site, we’re going to answer three questions:
- What is the purpose of this page?
- What action do we want users/visitors to take on this page?
- What’s preventing users/visitors from taking that action?
And the data in Google Analytics is going to help us with that. It won’t give us the answers, but it will give us clues.
Related: How to get actionable insights with a custom Google Analytics dashboard (via Opt-In Monster)
Business Impact
Business impact looks at how the site is contributing to our client’s bottom line. You’ll need to configure Google Analytics goals or eCommerce transactions for this one.
Goals with a dollar value help our client appreciate everything else. There’s a big difference between “this change is good for site visitors” and “this change is good for the business”.
We know that the two go hand-in-hand, but our client might not. So if we can connect the dots between a change on the site and the $$$ impact, we have some leverage to work with.
So going back to the examples from the previous step, goals would include:
- eCommerce transactions in the online store
- Lead capture form submissions on the real estate broker’s website
- Reservations made on the restaurant website
And then we include those numbers in whatever client reports we’re creating.
But while celebrating goal completions is great, we don’t want to end there.
We also want to:
- Work backward from successful goal completions to figure out what’s working.
- Do more of what’s working so we hit more goal completions.
So now we’re not only talking about the existing business impact. We’re making plans for improving business impact. And based on those improvements, we’re justifying our billable work.
Make sense? Awesome. Let’s keep going.
What tools do we use?
So now that we know what kind of data we need to pull out of Google Analytics, how do we actually pull it? Digging through the default Google Analytics reports takes too much time. We need to be more efficient.
Luckily we’ve got a few options to consider here:
Custom Reports within Google Analytics. You can export them as emails or standalone documents. You can also share them with others. Check out these collections of templates from KissMetrics, Avinash Kaushik, and ConversionXL. You can also explore the Google Analytics Solutions Gallery for more options.
Google Analytics + Google Sheets. I haven’t played with the Google Analytics + Sheets add-on very much, but I know some people who swear by it. The basic idea is that it opens up the data for manipulation and reporting within Google Sheets. Moz has a solid introductory walkthrough for it.
Google Data Studio. Now, this is something I’ve been playing with a lot more recently. Google Data Studio is a powerful (and free) tool for visualizing data from many sources. You can find some creative dashboard examples in the Data Studio Gallery. You should also check out this handy GDS resource list from Helpfullee.
I’m also throwing in a mention here for Quill Engage, because it’s such a handy tool. Quill Engage uses natural language generation to create automated reports about site performance. I like it as a sort of weekly executive summary of what’s happening on a site.
How do we present this to clients?
Alright, so we’re two-thirds of the way there. We know what data we want, and we know how to pull it out of Google Analytics. Now we need to combine that data with our recommendations and get it in front of our clients.
I’ve come across recommendations in my peer groups for MyWebAudit and AgencyAnalytics. These tools cater to web designers & developers.
If you happen to use ManageWP or GoDaddy Pro Sites (same platform), these also include client reports about the sites they’re monitoring. This is pretty darn handy if you’re using the same tools for site maintenance. (Full disclosure: I work at GoDaddy.)
I’m a stickler for brand consistency in client communications. So I would turn to Google Docs or Microsoft Word before sending anything to my clients. I’d pull the output from the reporting tools above (i.e. the text and the visuals) into the doc. Then I’d make sure the fonts, colors, etc… are all formatted and consistent with my branding.
Want to go the extra mile? Print the report on some decent-quality paper. Stick it in a nice branded folder. Meet with the client in-person, and walk through the report together.
If that isn’t doable, or if you feel guilty for using paper, throw it all into a PDF or presentation deck. Walk the client through it on a video call.
Start putting Google Analytics to work for you and your clients.
Google Analytics is a powerful tool that collects a lot of data. But if we’re not using that data, what’s the point of installing Google Analytics in the first place?
When it comes to client projects, we care about three big things: Overall site performance, individual page performance, and business impact. We can pull this data out of Google Analytics to inform and support the recommendations we make to our clients.
Even if we’re using automated reporting tools, we should take the time to polish what we present. So let’s package the information in a way that’s consistent with our brand’s fonts and colors. That might be a printed PDF we review in person. Or it might be an on-screen presentation we cover in a virtual meeting.
As web designers & developers, Google Analytics can do a lot for us. But it’s up to us to do the work.
Related articles
LifterLMS and Beaver Builder Integration: Effortless Online Course Websites
Introducing the LifterLMS and Beaver Builder integration. Streamline your online course website creation by combining powerful learning management tools with…
Figma to Beaver Builder: Design and Build WordPress Sites
Curious about converting Figma designs into WordPress websites? A smooth design-to-development workflow is essential for saving time and delivering top-notch…
Best Practices for Managing Web Design Clients
Managing web design clients effectively is one of the most crucial skills for a web designer, agency, or freelancer. Whether…
Join the community
We're here for you
There's a thriving community of builders and we'd love for you to join us. Come by and show off a project, network, or ask a question.
Since 2014
Build Your Website in Minutes, Not Months
Join Over 1 Million+ Websites Powered By Beaver Builder.
 Free Beaver Builder Templates! Get started at
